

top Tips
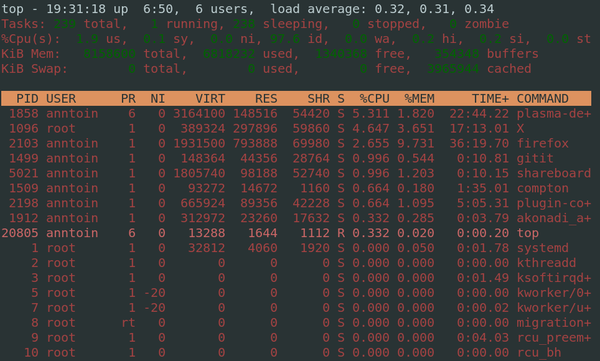
top is the standard process viewer on most distributions. It provides a wealth of information on activity on your system. In its default state top can be a bit unclear and hard to use, but some simple configuration changes can enhance its usability.1
How to Customise top
To customise your configuration you can open top and interactively change your settings. Then to save the configuration press W (capitalisation matters) and top will (over)write the .toprc file in your home directory.2
Colours
To enable coloured output press z.
If you want to change your colour scheme you can press Z which will bring you to a editing screen. Here you can set the colour of each area by selecting the ‘target’ and then the colour.
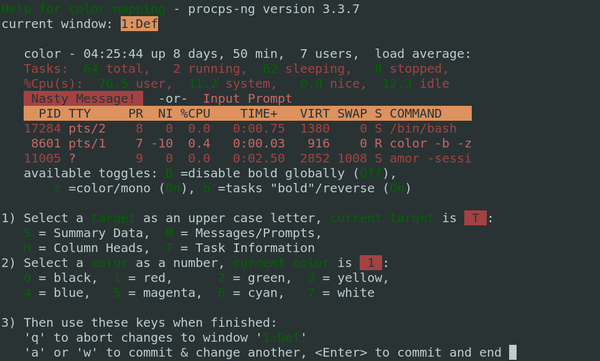
Note that the colour scheme of each window can be set separately and you can cycle through each window using the a and w keys.
Column highlight
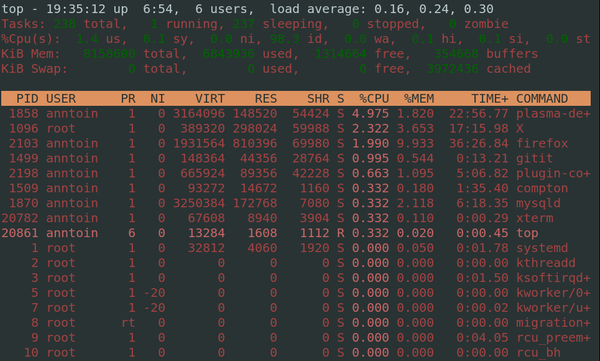
To highlight the current sort column press x. I find this option gives a much clearer view of what’s going on and simplifies navigation significantly.
You will also need to set this option for each ‘window’.
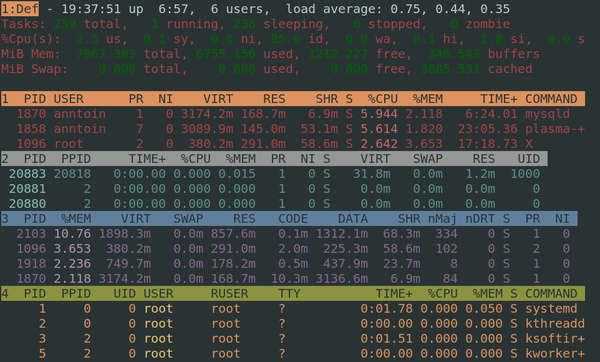
Alternate view
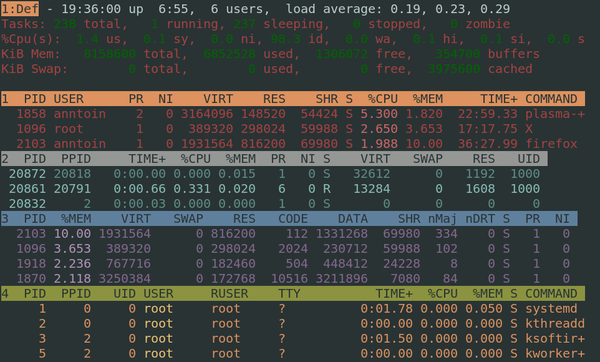
Press A to toggle the Alternate View. This gives you an overall view of all windows (also refered to as field groups) with the summary area of the selected window at the top of the screen. In this view the windows can be navigated using the a and w keys.
Display memory stats in MiB
I find memory in KiB slower to parse than in MiB. So to change this in the summary area you can cycle through KiB,MiB,GiB, and so on by pressing the E key. For the task area press the e key. Again to save your changes press W to write the configuration file.
Inspecting a process
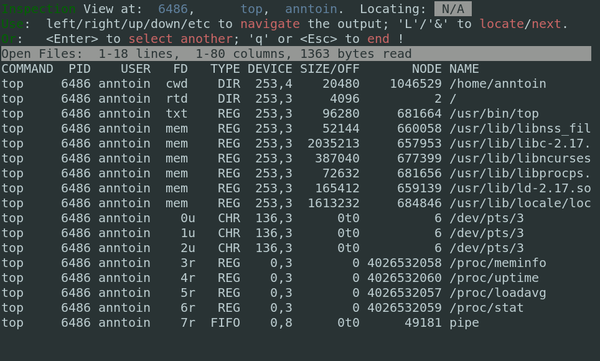
top allows you run custom commands and analyse their output. To enable this feature to work, the commands you wish to use must be appended to your configuration file. For example to inspect the files a process has open you can use a command like the following:
/bin/echo -e "pipe\tOpen Files\tlsof -P -p %d 2>&1" >> ~/.toprc
Then to access the inspection screen press the Y key followed by the PID of the process (or accept the default).
See the man page for more examples and further explanation of this feature.
Other useful commands to know
Display options
- c: Toggle showing full command line or just the command name of a process.
- i: Toggle showing idle tasks.
- f: Manage fields. This brings you to a screen where you can
- V: Toggle ‘forest mode’. Similar to
pstree. - L: Find a string, and & to find the next occurance. This is handy when searching for a specific process or searching in the inspect screen. customise the columns (fields) displayed.
Process control
- k: Kill a task.
- r: Renice a task.
The version I’m using here is provided by the procps-ng project. Check your local man pages to see if your
topsupport the same or similar options.↩The configuration file of
topis not the nicest to edit by hand so this is the recommended method of ‘editing’ your configuration.↩


